
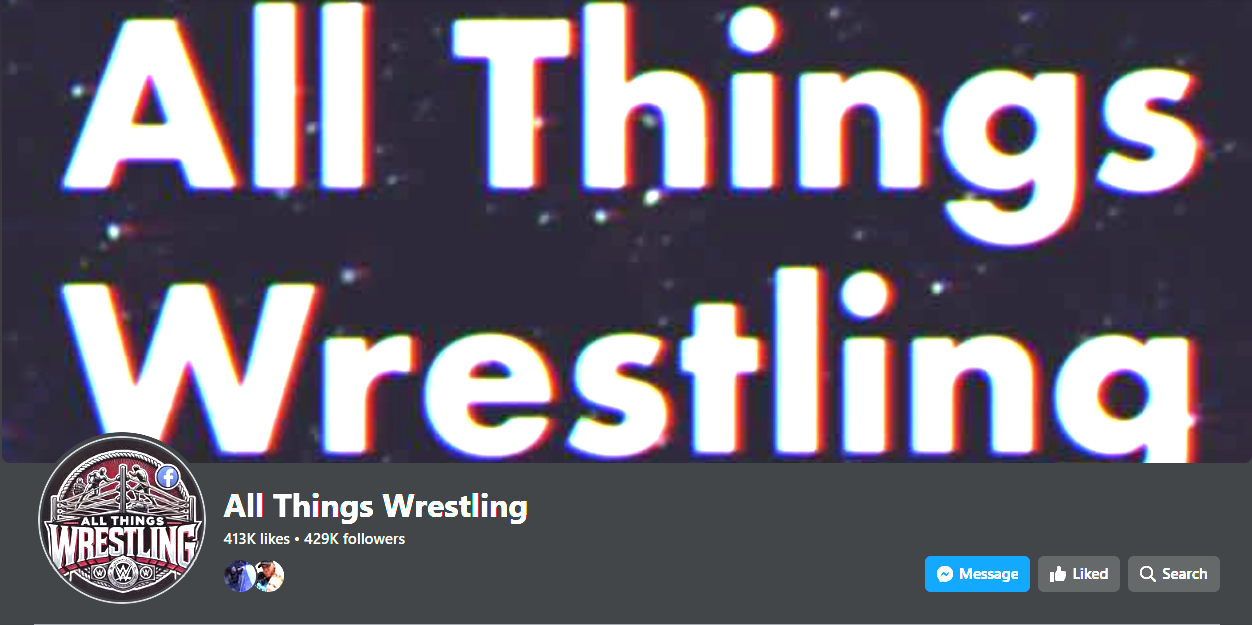
All Things Wrestling is a thriving Facebook community dedicated to passionate wrestling fans, boasting nearly 429,000 engaged members. As one of the most active and influential wrestling groups on the platform, it serves as a hub for discussions, breaking news, historical debates, and in-depth conversations surrounding the world of professional wrestling.
My Role & Impact
As the administrator and content strategist, I have played a pivotal role in growing and sustaining this vibrant community. Key contributions include:
Community Engagement & Moderation: Implementing strategies that foster meaningful interactions while maintaining a respectful and inclusive space for fans.
Content Strategy & Curation: Developing engaging posts, discussion prompts, and exclusive content that keep the audience actively participating.
Growth & Retention: Scaling the group from thousands to nearly half a million members through organic engagement, strategic promotions, and algorithm-friendly content.
Brand Partnerships & Collaborations: Establishing relationships with wrestling-related brands, promotions, and content creators to enhance the group's value.
Event Coverage & Live Discussions: Facilitating real-time conversations during major wrestling events, pay-per-views, and breaking news moments.
Achievements
Built a highly engaged community with consistent interaction, daily discussions, and viral content.
Successfully moderated a large-scale group, ensuring quality discourse while preventing spam and toxicity.
Expanded visibility and reach, making All Things Wrestling a go-to destination for wrestling enthusiasts.
All Things Wrestling is more than just a fan page, it’s a testament to digital community-building, content strategy, and audience retention. My experience in growing and managing this group showcases my expertise in social media engagement, content marketing, and digital brand growth within a niche but highly active audience.
This project exemplifies my ability to scale digital communities, craft compelling narratives, and leverage engagement strategies to create an online presence that resonates with thousands daily.
Jan 1, 24 - Dec 31, 24


All Things Wrestling
Engagement & Impact Metrics
This section highlights the key metrics, top-performing posts, and engagement insights that showcase the impact of All Things Wrestling. From viral discussions to milestone achievements, these stats reflect the group's growth, audience interaction, and content performance.
This data-driven breakdown not only demonstrates the strength of the group but also offers insights into how strategic content creation and community engagement drive long-term success in digital spaces.
Here, you'll find:
Membership Growth Trends – Tracking how the community has expanded over time.
Engagement Highlights – Featuring the most commented, liked, and shared posts.
Content Performance Insights – Showcasing which topics resonate most with our audience.
Milestone Achievements – Celebrating major breakthroughs, from surpassing follower goals to record-setting discussions.


